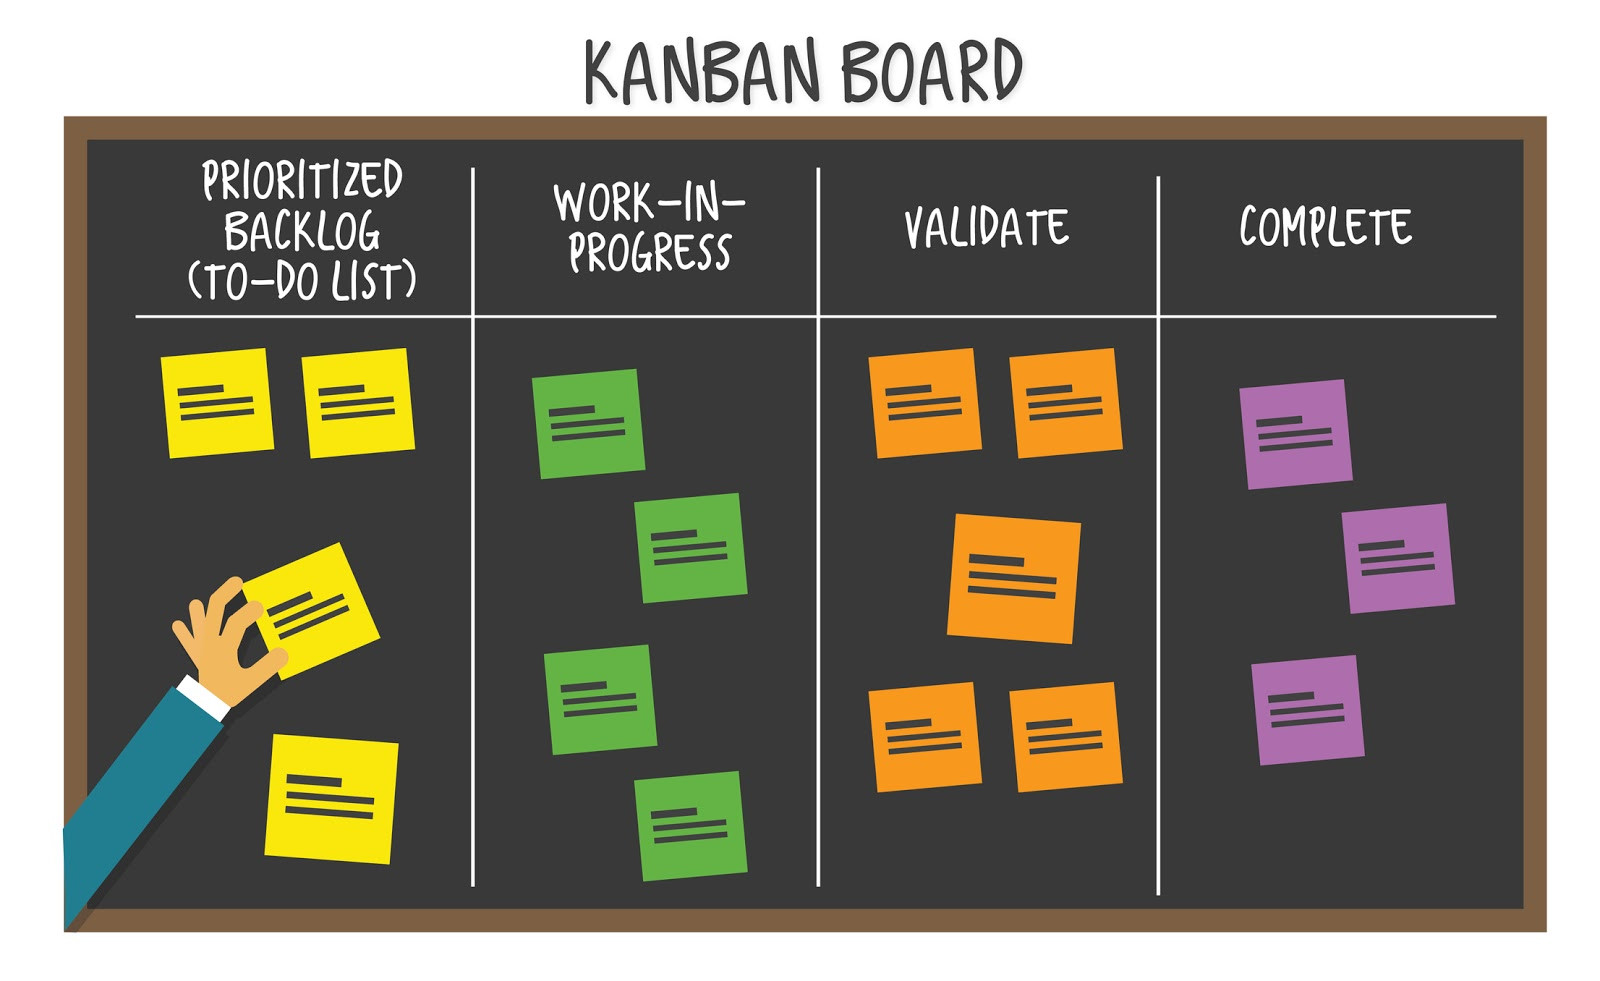
At the end of the last winter, I received the following email in my inbox, from one of my follower on techalyst.com, seeking my help to write a Laravel query to export data to create a retention curve chart (Weekly cohorts) from mysql database.
Following is his requirement,
Mission
• Analyses of how members flow through the registration process on our site.
• Get analytics in how the registration process improves over time.
• Get information on where we should improve the registration process; where do members get stuck?
Background of App
system has just optimized the registration flow. After signing up for an account, the member has to complete a series of steps (form) to complete their profile.
The current steps in registration follow are:
1. Make account - 0% (Step 1)
2. activate account - 20% (Step 2)
3. Complete profile information - 40% (Step 3)
4. interested in Jobs? - 50% (Step4)
5. experience in these jobs? - 70% (Step5)
6. are you Parttime worker? - 90% (Step6)
7. waiting for final review - 99% (Step 7 )
8. approval - 100% (Step8)
At the moment we don't know how members are performing in the Registration flow. We want to know where many members get stuck, so we can make improvements. We want to create a retention curve chart that shows how far a group of members (weekly cohorts) came in the registration process.
Assumptions.
• The chart will look like the one below.
• The chart has one line per weekly cohort.
• The vertical axis is the percentage of members who have been or are still in this step.
• The horizontal axis represents the step in the registration process (based on the step percentage).
• On the first step (X=0) 100% of the members are still active, so all charts start at X=0 Y=100%.
• An export of the Members database table with relevant information attached
Help Needed
Laravel function producing JSON data
Represent the data in web frontend in a chart using Highcharts
Following is the snap of the Member On Boarding table in the database.

expected output in the chart

here is my full solution for his requirement,
first i made a Laravel eloquent model for member-oboarding table
<?php

namespace Techalyst\Chart\Models;

use Illuminate\Database\Eloquent\Model;
class Member extends Model
{
    protected $table = 'member_onboarding';
    public $timestamps = false;


}
and the following is my complete solution which return the json data required by the jquery high-chart in the front end,
solution requires a complex query to rotate the data from columns to row, This type of rotation of data from columns to rows is known as PIVOTING in terms of SQL. MySQL does not have a native pivot function but we can use an aggregate function with a CASE expression as an alternative to PIVOTING to get the result
public function dataAction(Request $request)
{

$weekly_retention =
    Member::select([
        DB::raw('DATE_ADD(created_at, INTERVAL(2-DAYOFWEEK(created_at)) DAY) AS week_start'),
        DB::raw('CONCAT(YEAR(created_at), "/", WEEK(created_at)) AS week_name'),
        DB::raw('SUM(CASE WHEN onboarding_perentage <= 100 THEN 1 ELSE 0 END) AS Step1'),
        DB::raw('SUM(CASE WHEN onboarding_perentage > 0 AND onboarding_perentage <= 100 THEN 1 ELSE 0 END) Step2'),
        DB::raw('SUM(CASE WHEN onboarding_perentage > 20 AND onboarding_perentage <= 100 THEN 1 ELSE 0 END) Step3'),
        DB::raw('SUM(CASE WHEN onboarding_perentage > 40 AND onboarding_perentage <= 100 THEN 1 ELSE 0 END) Step4'),
        DB::raw('SUM(CASE WHEN onboarding_perentage > 50 AND onboarding_perentage <= 100 THEN 1 ELSE 0 END) Step5'),
        DB::raw('SUM(CASE WHEN onboarding_perentage > 70 AND onboarding_perentage <= 100 THEN 1 ELSE 0 END) Step6'),
        DB::raw('SUM(CASE WHEN onboarding_perentage > 90 AND onboarding_perentage <= 100 THEN 1 ELSE 0 END) Step7'),
        DB::raw('SUM(CASE WHEN onboarding_perentage = 100 THEN 1 ELSE 0 END) Step8')
    ])
    ->groupBy('week_name')
    ->orderBy(DB::raw('YEAR(created_at)'),'ASC')
    ->orderBy(DB::raw('WEEK(created_at)'),'ASC')
    ->get();

    $chartArray ["chart"] = array (
        "type" => "line"
    );
    $chartArray ["title"] = array (
        "text" => "Weekly Retention Curve"
    );
    $chartArray ["credits"] = array (
        "enabled" => false
    );
    $chartArray ["xAxis"] = array (
        "categories" => array ()
    );
    $chartArray ["tooltip"] = array (
        "valueSuffix" => "%"
    );

    $categoryArray = array (
        '0',
        '20',
        '40',
        '50',
        '70',
        '90',
        '99',
        '100'
    );

    $chartArray ["xAxis"] = array (
        "categories" => $categoryArray
    );
    $chartArray ["yAxis"] = array (
        "title" => array (
            "text" => "Total Onboarded"
        ),
        'labels' => array(
            'format' => '{value}%'
        ),
        'min' => '0',
        'max' => '100'
    );


    foreach ($weekly_retention as $week){
        $dataArray = array();

        for($i = 1; $i <= 8; $i++){

            if($i == 1){
                $dataArray[] = 100;
            }else{
                $dataArray[] = round(($week->{"Step".$i}/$week->Step1) * 100);
            }

        }


        $chartArray ["series"] [] = array (
            "name" => $week->week_start,
            "data" => $dataArray
        );
    }

    return response()->json($chartArray)->setEncodingOptions(JSON_NUMERIC_CHECK);


}
and here is the final out put of my solution for the requirement rendered by highchart

Due to Busy work schedule , I couldn't explain the solution step by step, if you have any question please write it bellow in the comment box and i will respond you.


Be the first one to write a response :(
{{ reply.member.name }} - {{ reply.created_at_human_readable }}